Now Reading: What is Indicator Based Analysis? Where We Can Use Indicators?
-
01
What is Indicator Based Analysis? Where We Can Use Indicators?
What is Indicator Based Analysis? Where We Can Use Indicators?
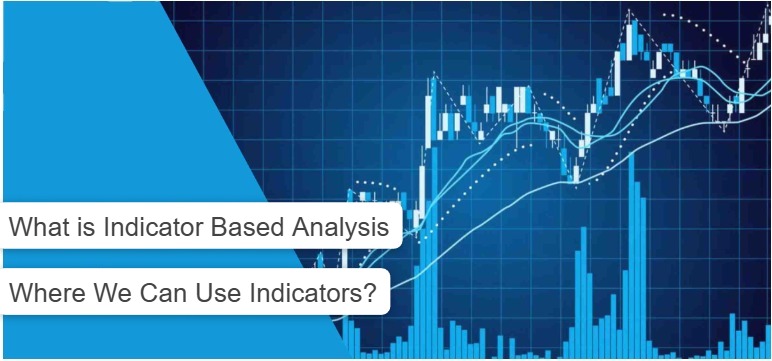
In this topic we are going to discus about what is indicator based analysis? Where we can use indicators? Are Indicators trust worthy? these are some important thing that you need to understand if you are going to use indicators in trading. So let’ first discus what is indicators base analysis.
Indicator base analysis is a method where traders use technical indicator for understanding the market price, movement, trend, possible/good entry and exit.
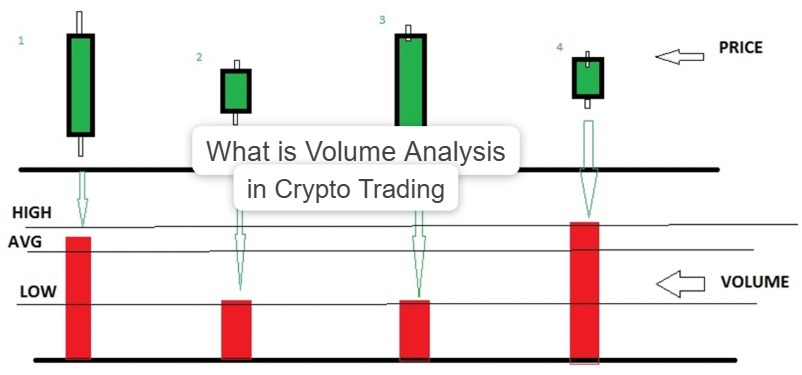
Indicator used mathematical calculations and formulas to analyze the market movement and volume. indicators are very helpful when it comes to volume, market data and price.
Indicator Based Analysis
Indicator based analysis is a type of technical analysis where trade use various type of indicators like RSI, MACD, EMA and many more other type of indicators.
There are some Important things that indicator based analysis do like,
These indicators take data of price(like close, open, high, low), volume, time, and then convert these data into signals like Trend direction, strength of move, overbought zone, oversold zone, reversal and breakout.
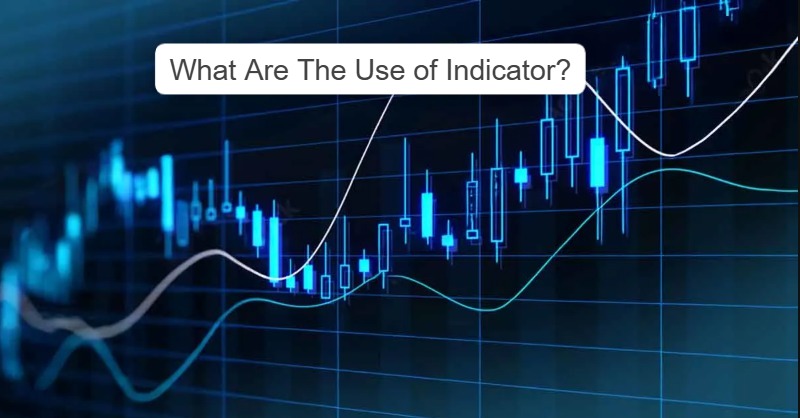
What Are The Use of Indicator?
This is very important for you to know why indicators are used for? what are the uses of indicator are?
Indicators Help traders in many ways and tell them many thing in short period of time many traders use indicators for saving there time many traders use them as a double checking there trade and many other reasons,
There are many areas where indicator help traders and we will discus what are those areas and there uses are ,
Identify Trend
Indicators help trader to find out if market is good to enter or not, what are the direction of the market is like market is moving in uptrend(upward, Bullish), downtrend(downward, Bearish) or sideways. you can identify market trend by using indicators. there are some good indicator which you can use to identify the market trend like
- Moving Averages (MA)
- MACD
- ADX
Finding Momentum(Strength of Move)
There are some indicators that shows market momentum and tell traders how strong or weak the market currently is, how many other buyers are buying this coin, is it good time to invest or not.
There are some good indicators that many traders are using and finding momentum(strength of move).
- RSI
- Stochastic
- MACD Histogram
Spot Overbought & Oversold Zones
These areas tell traders when may the market will reverse(go upward to downward or downward to upward).
There are some good indicators that tell trader if the market may fall or will go bullish, and what are the overbought and oversold zones are.
- Stochastic
- RSI
- CCI
Confirm Breakouts / Reversals
In this area traders confirm if the break out is real of fake, traders find this about after checking is there any buyers who will buy this coin, how much volume will increase after the breakout confirm, is there will be any reversal after breakout. Traders tell if the breakout is real or fake after confirming these.
Traders use some good indicators to tell if the breakout is real or fake,
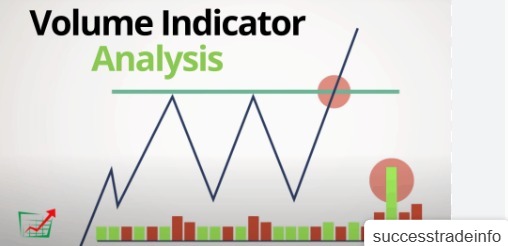
- Volume indicators
- MACD crossovers
- Moving average crossover
Predict Volatility
In this traders find out how much will price move, like where will be the highest or lowest point of price will be if price start, that help traders to make maximum profit and minimum loss.
Traders use some good indicators here that help them predict volatility,
- Bollinger Bands
- ATR(average True Range)
Find Entry and Exit Points
In this Indicator tell you if the market is safe or is it risky to enter the trade and find you the good entry and exit point.
There are some good indicators sign that help you find good entry and exit points,
- Buy when RSI oversold
- Sell when MACD crosses down
- Buy when price above MA
Reduce Emotional Trading
Indicators did not thing emotionally they tell you after analyzing and calculating the risk, that is the reason why traders also use indicators, it help traders to find best answers/solution in short period of time, But as always also don’t 100% trust indicator they use mathematical equations and calculations and some time they can be wrong so double check yourself also for safety.
These are some areas where you can use Indicator Based Analysis.
Are Indicators Trust worthy
No, don’t blindly trust indicators, indicators are helpful and make trading easy But they are not always right, indicators help you to trade more accurately and more safely but it’s not grunted result. But when you use chart analysis(use your own chart analysis separately, it will help you understand the market)+ Risk management+ news and and social media information and indicator your chances of successful trade will increase, so use Indicator as helping tool don’t blindly do every thing that indicator say also search on your won.
This is all for now, successtradeinfo will teach you many more thing in future so stay with us here.
If you want to know What is Indicator? How Can You Use Indicator in Trading then click here
If you want to know what is chart analysis then click here.
If you want to know about what is risk management then click here.
If you want to know what is trading strategy then click here.
If you want to create binance account then click this link: https://www.binance.com/referral/earn-together/refer2earn-usdc/claim?hl=en&ref=GRO_28502_HLQT7&utm_source=default