Now Reading: What is Candlestick Pattern Analysis? What Are There Use and Type? Beginner friendly Guide
-
01
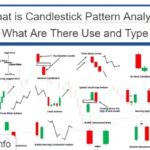
What is Candlestick Pattern Analysis? What Are There Use and Type? Beginner friendly Guide
What is Candlestick Pattern Analysis? What Are There Use and Type? Beginner friendly Guide
Candlestick pattern analysis is a method that traders used in technical analysis to understand market behavior and predict the price movement using candlestick chart.
You can change candle time frame like 1min, 2min, 5min, 30min, 4hour, 1Day and more, every time frame show you different chart/candle, if you want short term enter and exit market strategy use 5 min to 4 hour chart and if you want long term investment plan then use 1 day chart.
First you need to understand what is Candlestick and how trade use candlestick in charts analysis.
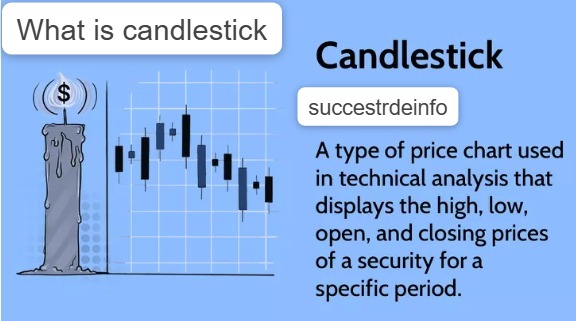
What is Candlestick?
Candlestick is a graphical representation that shows price movement within a specific time period.
in simple word it is in a form of candle that show a coin price in your choosing time frame(1 min, 2 min, 5min, 30min, 4hour, 1Day).
Candlestick tell you about 4 type of price movements like,
- Open(price start moving at the time frame that you select when new candle is make).
- Close(Price stop moving at the chosen time frame when candle time is complete, when that happened new candle is make instantly and start moving).
- High(When price reach it’s highest).
- Low(when price reach it’s lowest).
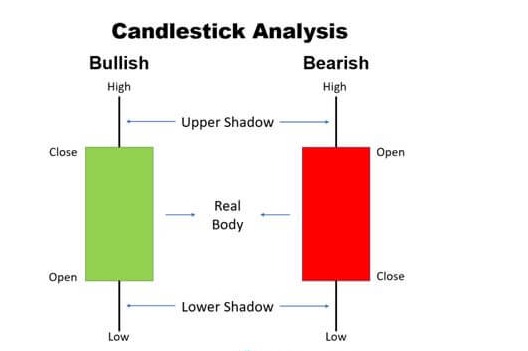
Candlestick has 2 main parts that we called body and shadow.
Body
Candle body has thick rectangular part, that has it’s color according to what price is close(high or low),
If price is higher then the previous candle price then the candle color will be green and if price is lower then the previous candle price then the color will be red.
In candle color shows direction like if price open in new candle at 1.1$ close at 1.2$ at 30min time frame Green=bullish.
If price open in new candle at 1.1$ and close at 1$ in 30min time frame it’s Red=bearish.
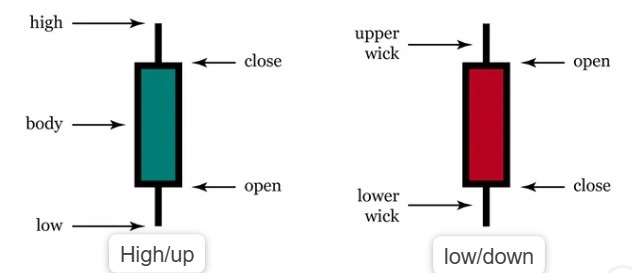
Shadow
Candles make thin line when price move from starting price at high to low or low to high, shadow also called wicks.
What Is Candlestick Pattern Analysis?
In Candlestick pattern analysis traders study one single candlestick or group of candlestick to understand coin like,
- who is strong buyers or sellers(it tell you where next candle might close)
- is the trend that are right now will continue or the trend will reverse
- Is market at any risky point where it might dump or pump.
- Is it good time or enter or exit the market.
Candlestick pattern analysis help traders to make decision(without indicators alone).
There are some type of candlestick pattern that is important for you to know.
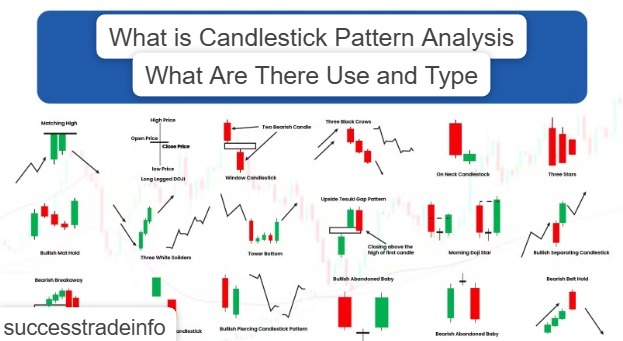
Type Of Candlestick Pattern
There are Many type of candlestick pattern but we will discus major three type of candlestick pattern Bullish Reversal Pattern, Bearish Reversal Pattern, Continuation Pattern.
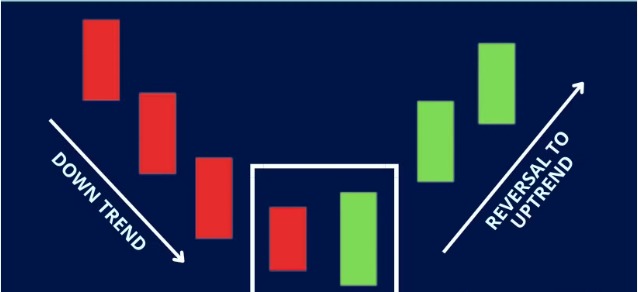
Bullish Reversal pattern
In bullish reversal pattern is a candlestick pattern which tell that may the market will move up(bullish) or not.
There are some pattern that suggest you that price may go upward(bullish).
Bullish Engulfing
In bullish engulfing after small red candle a big green candle cover the red, and when that happened it’s means strong buying pressure and coin may go upward next.
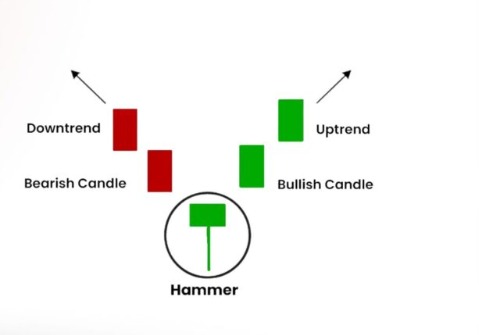
Hammer
When a small body at the top with a long shadow appear after downtrend that called hammer.
When Hammer make that’s mean sellers are trying to push price down but on the other hand buyers are pushing it back in upward.
Piercing Pattern
In piercing pattern First candle is Big red and second candle is Green candle that opens lower but closes above at least 50% of the red candle
That pattern shows buyer are increasing.
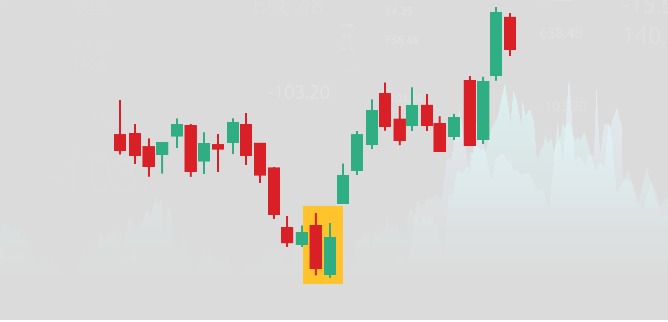
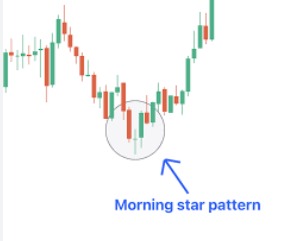
Morning Star
Morning star pattern is 3 candles pattern where first candle is big red, Second candle is small candle does not matter if it’s green or red, third candle is big green candle, If these are showing that’s mean there are high chance from bearish to bullish.
Inverted Hammer
If after a downtrend a smaller body at the down with a long shadow appear that’s called Inverted Hammer.
That’s also mean a market may move upward.

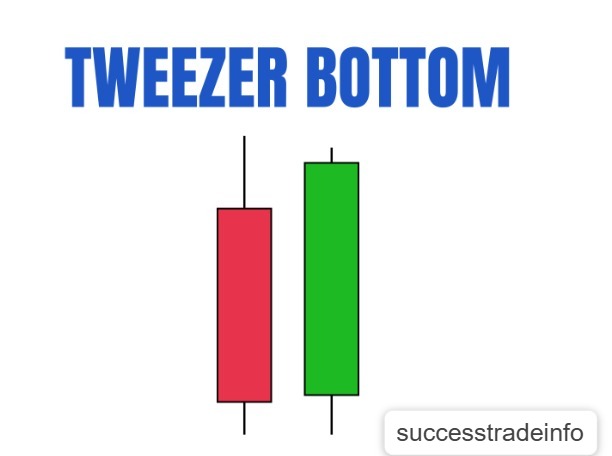
Tweezer Bottom
When two candle with the same lower price close that a strong support and market may reverse upward.
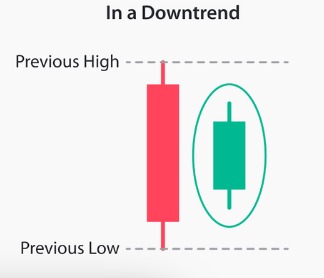
Inside Bar
Inside bar candle also called bullish harami in this pattern a small green candle inside the body of the previous large red candle show when that happened that’s mean market may move upward again.
Bearish Reversal Pattern
Bearish reversal pattern is a candlestick pattern where they tell that market may move downward(bearish).
there are some pattern that tell if market might move downward,
Bearish Engulfing
When after a small green a big red candle that cover the previous small green candle create it’s mean the market may move downward(bearish)
Shooting Star
When a small body at the bottom made with long shadow at top after a uptrend, it’s mean market may bearish because buyers were trying to push the market but failed and now market may move from uptrend to downtrend.
Evening Star
It’s a three candlestick pattern, In first candle is big green candle after then one small candle (does not matter green or red) the third candle will be big red candle when that pattern match market may move downward.
Hanging Man
When a small body at the top with a long shadow appear after uptrend that called hanging man, it’s just like hammer trend but in this hammer follow in uptrend .
These are some bearish reversal patterns.
Continuation Pattern
In continuation pattern market shows that the market will not move in uptrend or downtrend it will be stable for some time before going or moving anywhere
There are some type of continues trend,
- Bullish Continuation Patterns (Uptrend continues)
- Bearish Continuation Patterns (Downtrend continues)
This is all for now, successtradeinfo will teach you many more thing in future so stay with us here.
If you want to know what is chart analysis then click here.
If you want to know about what is risk management then click here.
If you want to know what is trading strategy then click here.
If you want to create binance account then click this link: https://www.binance.com/referral/earn-together/refer2earn-usdc/claim?hl=en&ref=GRO_28502_HLQT7&utm_source=default